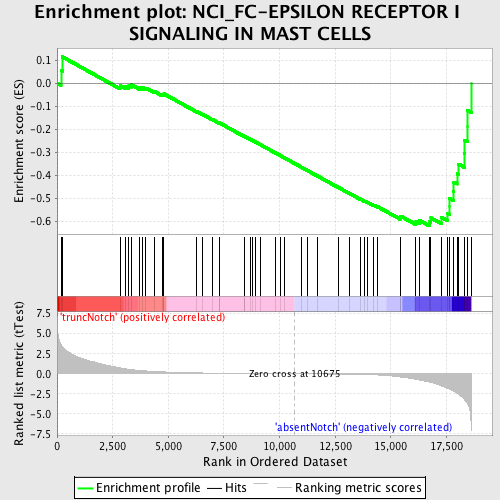
Profile of the Running ES Score & Positions of GeneSet Members on the Rank Ordered List
| Dataset | Set_03_absentNotch_versus_truncNotch.phenotype_absentNotch_versus_truncNotch.cls #truncNotch_versus_absentNotch |
| Phenotype | phenotype_absentNotch_versus_truncNotch.cls#truncNotch_versus_absentNotch |
| Upregulated in class | absentNotch |
| GeneSet | NCI_FC-EPSILON RECEPTOR I SIGNALING IN MAST CELLS |
| Enrichment Score (ES) | -0.6215158 |
| Normalized Enrichment Score (NES) | -1.6184568 |
| Nominal p-value | 0.0 |
| FDR q-value | 0.26242062 |
| FWER p-Value | 0.862 |
| PROBE | DESCRIPTION (from dataset) | GENE SYMBOL | GENE_TITLE | RANK IN GENE LIST | RANK METRIC SCORE | RUNNING ES | CORE ENRICHMENT | |
|---|---|---|---|---|---|---|---|---|
| 1 | HRAS | 1980551 | 175 | 3.618 | 0.0569 | No | ||
| 2 | MAPK3 | 580161 4780035 | 236 | 3.390 | 0.1157 | No | ||
| 3 | RELA | 3830075 | 2827 | 0.731 | -0.0104 | No | ||
| 4 | PPAP2A | 1170397 3440288 3930270 | 3063 | 0.624 | -0.0116 | No | ||
| 5 | NFKB1 | 5420358 | 3229 | 0.564 | -0.0102 | No | ||
| 6 | LAT | 3170025 | 3335 | 0.527 | -0.0062 | No | ||
| 7 | HCLS1 | 7100309 | 3709 | 0.415 | -0.0187 | No | ||
| 8 | CBLB | 3520465 4670348 | 3829 | 0.390 | -0.0180 | No | ||
| 9 | LAT2 | 5340440 | 3994 | 0.354 | -0.0203 | No | ||
| 10 | PXN | 3290048 6400132 | 4361 | 0.291 | -0.0347 | No | ||
| 11 | FOS | 1850315 | 4728 | 0.238 | -0.0501 | No | ||
| 12 | PTPN13 | 2060681 | 4788 | 0.231 | -0.0490 | No | ||
| 13 | PLA2G1B | 460500 | 4803 | 0.229 | -0.0456 | No | ||
| 14 | SPHK1 | 2470113 4230398 6220397 | 6280 | 0.109 | -0.1231 | No | ||
| 15 | SOS1 | 7050338 | 6527 | 0.096 | -0.1346 | No | ||
| 16 | IKBKG | 3450092 3840377 6590592 | 6989 | 0.078 | -0.1580 | No | ||
| 17 | DOK1 | 1050279 2680112 5220273 | 7282 | 0.069 | -0.1725 | No | ||
| 18 | FCER1A | 1050671 | 7305 | 0.068 | -0.1724 | No | ||
| 19 | FCER1G | 5550020 | 8426 | 0.041 | -0.2320 | No | ||
| 20 | VAV1 | 6020487 | 8442 | 0.041 | -0.2321 | No | ||
| 21 | PIK3R1 | 4730671 | 8679 | 0.035 | -0.2441 | No | ||
| 22 | GAB2 | 1410280 2340520 4280040 | 8801 | 0.033 | -0.2500 | No | ||
| 23 | PLD2 | 2850097 | 8934 | 0.030 | -0.2566 | No | ||
| 24 | MAP2K7 | 2260086 | 9136 | 0.026 | -0.2669 | No | ||
| 25 | LYN | 6040600 | 9800 | 0.015 | -0.3024 | No | ||
| 26 | MS4A2 | 2940594 | 10040 | 0.010 | -0.3151 | No | ||
| 27 | NFATC2 | 70450 540097 | 10214 | 0.008 | -0.3243 | No | ||
| 28 | PTPN11 | 2230100 2470180 6100528 | 10987 | -0.005 | -0.3658 | No | ||
| 29 | AKT1 | 5290746 | 11234 | -0.010 | -0.3788 | No | ||
| 30 | SYK | 6940133 | 11709 | -0.018 | -0.4040 | No | ||
| 31 | PIK3CA | 6220129 | 12656 | -0.041 | -0.4543 | No | ||
| 32 | PLA2G4A | 6380364 | 13137 | -0.056 | -0.4791 | No | ||
| 33 | JUN | 840170 | 13623 | -0.077 | -0.5038 | No | ||
| 34 | FYN | 2100468 4760520 4850687 | 13831 | -0.091 | -0.5133 | No | ||
| 35 | PLCG1 | 6020369 | 13938 | -0.098 | -0.5172 | No | ||
| 36 | LCP2 | 2680066 6650707 | 14240 | -0.126 | -0.5312 | No | ||
| 37 | DUSP1 | 6860121 | 14399 | -0.144 | -0.5370 | No | ||
| 38 | MAP2K2 | 4590601 | 15417 | -0.392 | -0.5846 | No | ||
| 39 | SHC1 | 2900731 3170504 6520537 | 15440 | -0.398 | -0.5785 | No | ||
| 40 | MAP2K1 | 840739 | 16129 | -0.683 | -0.6031 | Yes | ||
| 41 | IKBKB | 6840072 | 16300 | -0.784 | -0.5979 | Yes | ||
| 42 | MAPK1 | 3190193 6200253 | 16740 | -1.029 | -0.6027 | Yes | ||
| 43 | BTK | 3130044 | 16802 | -1.068 | -0.5864 | Yes | ||
| 44 | WIPF1 | 1170577 | 17277 | -1.514 | -0.5842 | Yes | ||
| 45 | CBL | 6380068 | 17537 | -1.799 | -0.5652 | Yes | ||
| 46 | FCGR2B | 780750 | 17632 | -1.907 | -0.5353 | Yes | ||
| 47 | GRB2 | 6650398 | 17634 | -1.909 | -0.5004 | Yes | ||
| 48 | RASA1 | 1240315 | 17822 | -2.176 | -0.4706 | Yes | ||
| 49 | RAF1 | 1770600 | 17834 | -2.195 | -0.4310 | Yes | ||
| 50 | PAK2 | 360438 7050068 | 17976 | -2.411 | -0.3944 | Yes | ||
| 51 | MAPK8 | 2640195 | 18042 | -2.526 | -0.3516 | Yes | ||
| 52 | MAP3K1 | 5360347 | 18311 | -3.211 | -0.3072 | Yes | ||
| 53 | ITK | 2230592 | 18320 | -3.240 | -0.2483 | Yes | ||
| 54 | MAP2K4 | 5130133 | 18441 | -3.735 | -0.1864 | Yes | ||
| 55 | CHUK | 7050736 | 18443 | -3.743 | -0.1178 | Yes | ||
| 56 | PTK2 | 1780148 | 18615 | -6.937 | 0.0001 | Yes |

